 |
|
| m/z |
| m/z | Relative
abundance (%) |
Assignment
|
|
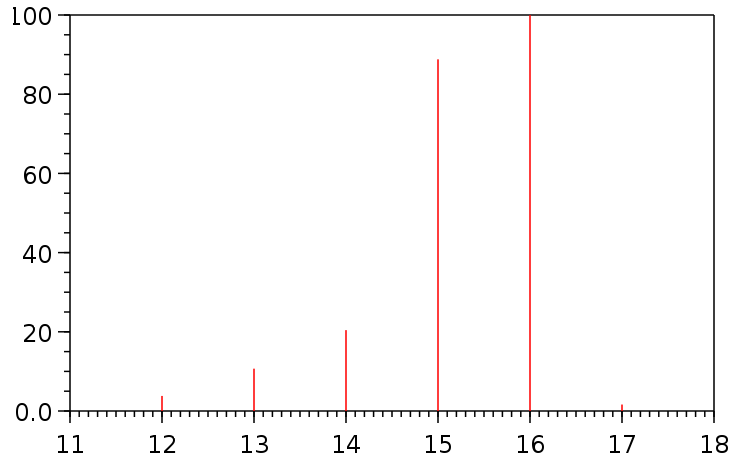
| 18 |
<
0.5 |
M+2 | Molecular ion |
| 17 |
1.1 |
M+1 | Molecular ion |
| 16 |
100.0 |
M | Molecular ion; base peak |
| 15 |
85.0 |
M - H |
Fragment |
| 14 |
9.2 |
M - 2H |
Fragment |
| 13 |
3.0 |
M - 3H |
Fragment |
| 12 |
1.0 |
M - 4H |
Fragment |